Create data integration platform
Business problem:
As a B2B SaaS tech startup, Celigo had a very bare-bones experience. Only developers who were absolutely determined could get past the high learning curve and lack of any onboarding. Everything was hidden in a "mystery-meat" app drop-down, which made it impossible to know where you were in the app, how to get back, or to discover functionality and get to value quickly. At this point, Celigo was barely in the Gartner Magic Quadrant, very low in the Niche quadrant. As a result of these efforts, Celigo made a big jump in 2023 towards the Leaders quadrant.
Summary:
I built the platform design and UX strategy as a team of one, gradually expanding the team to the international team it is today. I started with applying UX principles and reducing the visual weight of the design to focus on the task at hand, not the chrome around it. The other major focus was to get people to value more quickly. Instead of forcing them to stop to create a connection, the new design got them right into building flows.
Challenges:
- no budget for design tools
- no budget for research
- starting as a team of one
- engineering-run company did not see the benefit in UX, so needed to build that trust and buy-in
- no consistent visual language
- no onboarding
- high cognitive burden
Process & methodologies:
- started creating in Sketch, eventually moved to Figma to vastly improve collaboration and asynchronous communication
- built relationships with services and support teams, to understand customers' pain points; was then invited to customer calls
- attended Office Hours, where customers could get help on-the-fly. This helped me understand usability issues, doc gaps, and customer needs and pain points.
- performed competitive analysis
- created visual language
- created information architecture
- set up platform status tracking
- cognitive walkthroughs and usability testing with internal and external stakeholders,
- created design review process,
Tools:
- Sketch, Illustrator, Figma
- Google Analytics and Google Search Console,
- Axure,
- HTML/CSS and JavaScript to test code
Overall platform design
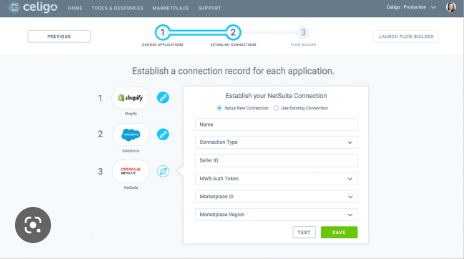
Overall platform: Original design
The original design hid everything relevant in a application drop-down. There was no sidebar and no clear way of navigation. Users had no idea how many flows were in each tile, what success or failure meant. Additional icons were only visible on hover to get to settings and a dashboard. It had a very heavy design.

Overall platform: New design
Instead of forcing users to stop to create a connection, the new design got them right into building flows. From this, I gained support for users to not have to create connections at all, but just to map out their flow. This aligned with customer research, in that LOB (business) users would be able to map out the flows, only turning to development for more complex things like setting up authentication connections to different applications or mapping complex JSON records.
- Decreased visual weight of design, focusing on the most important tasks, which were building and managing flows.
- Added breadcrumb so that users always knnow where they are and how to get back.
- Added sidebar instead of top navigation with app drop-down. The initial "mystery-meat" navigation gave no indication of what was available.
- Created forms for configuring applications
- Ability to test whether the application was configured correctly before ever running the flow.
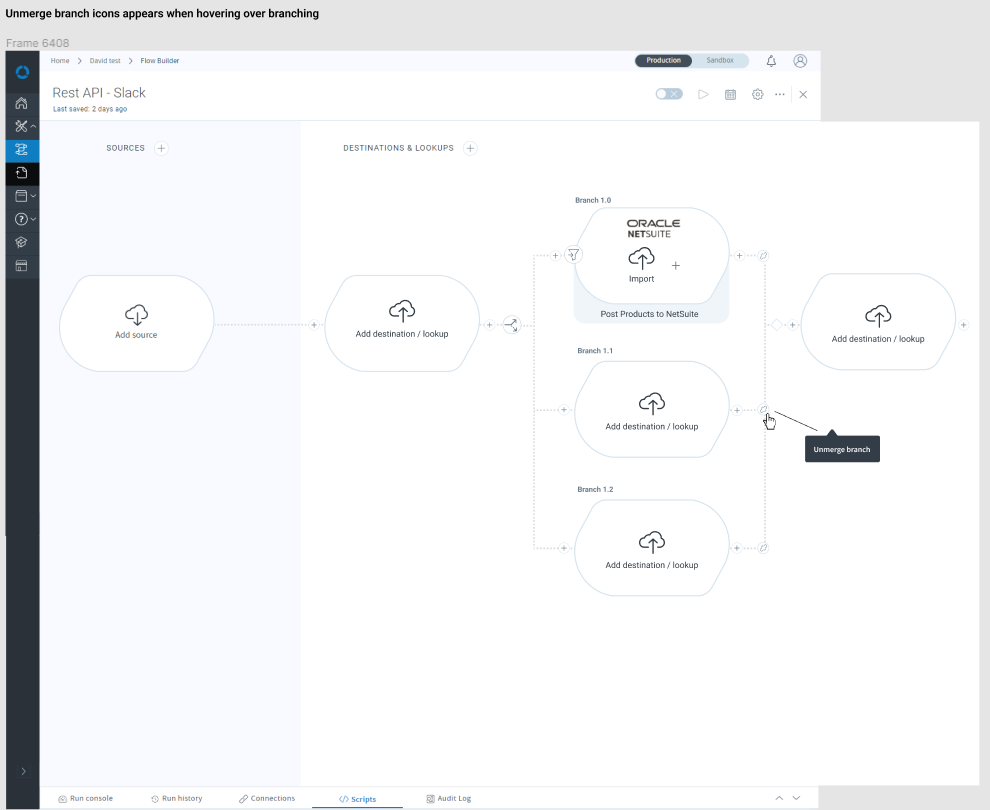
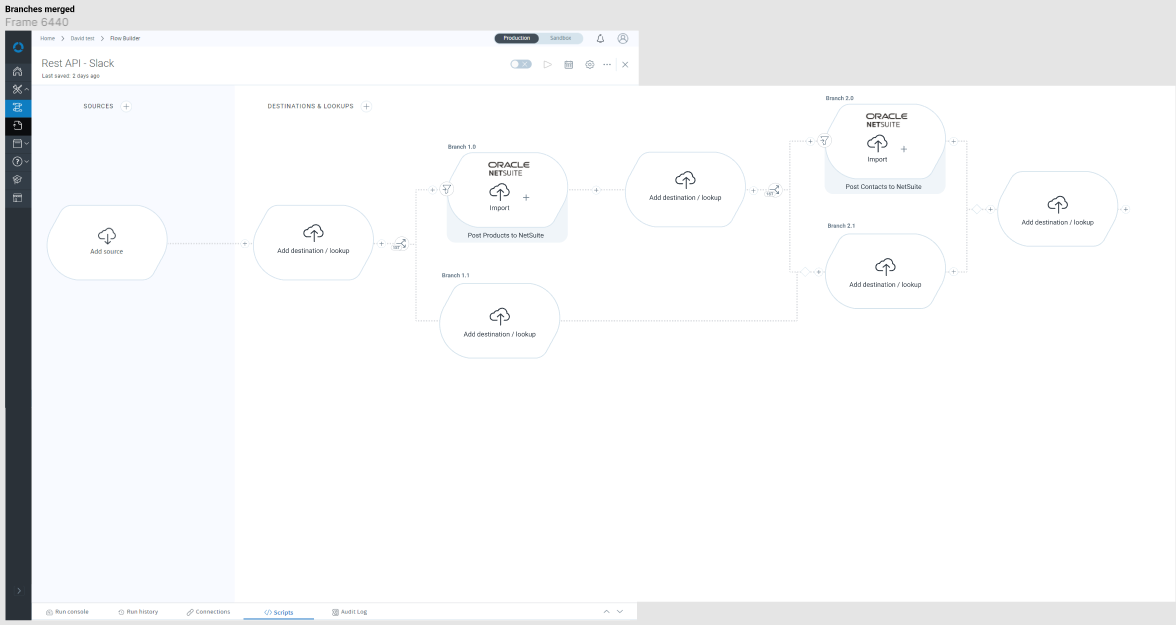
- Flow branching
- Brought forward input and output to test mapping, as well as aligning previously flat mapping structure with users' nested mental model
- Decreased clicks and context switches for error management by 100%, enabling users to quickly manage all errors across a flow. This was a game-changer and customers and employees loved it.
- Ability to replace connections. Initially, users could not make many changes to flows, and could not swap out connections.
Home list view
Home list view: Original design
- Used large tiles that did not let users creating custom flows or using templates know which applications were in each integration
- Did not bring critical information forward. Users could not tell when a flow in the integration was last updated, how many flows were in the integration, or when the last unresolved error had occurred
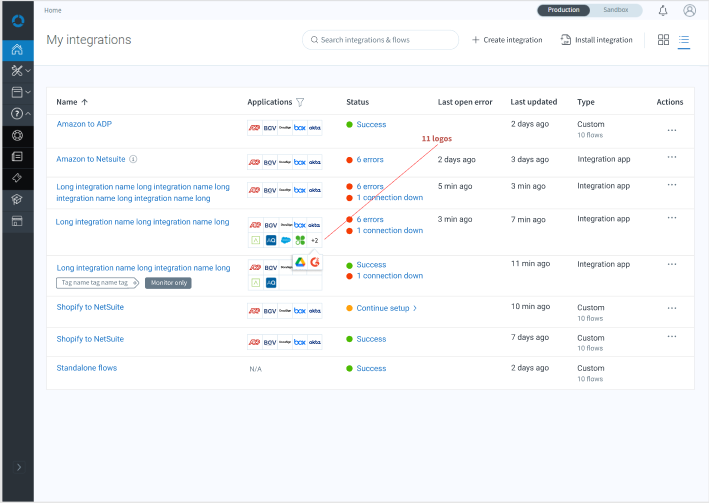
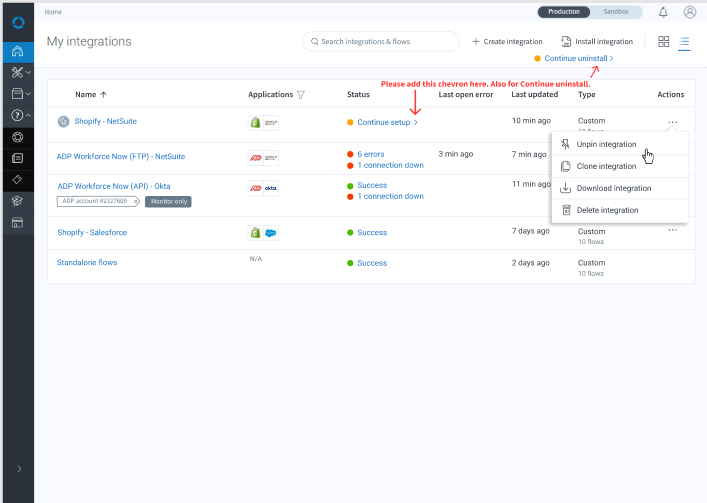
Home list view: New design
The new design brings forward important information such as when the integration was last updated and when the last unresolved error ocurred, which is critical information for troubleshooting a flow that was working, but suddenly is getting lots of errors.
- Makes it easy to understand which integrations have errors
- Brings forward which applications are used in the integration and how many flows are in each integration.
- Shows when the integration was last updated
- Shows when the last error that has not been resolved yet occurred
- Not implemented yet: Currently only active flows are shown, but ideally it should show inactive flows as well, as a reminder for users to get these flows running, which is the company's North Star, such as 4 active / 10 flows.
- Not implemented yet: Users are confused by the term, Success, which doesn't bring any information forward. Ideally, this would show the number of successful records sent in the last run, so that users could tell at a glance whether any records had errored out.
Flow builder
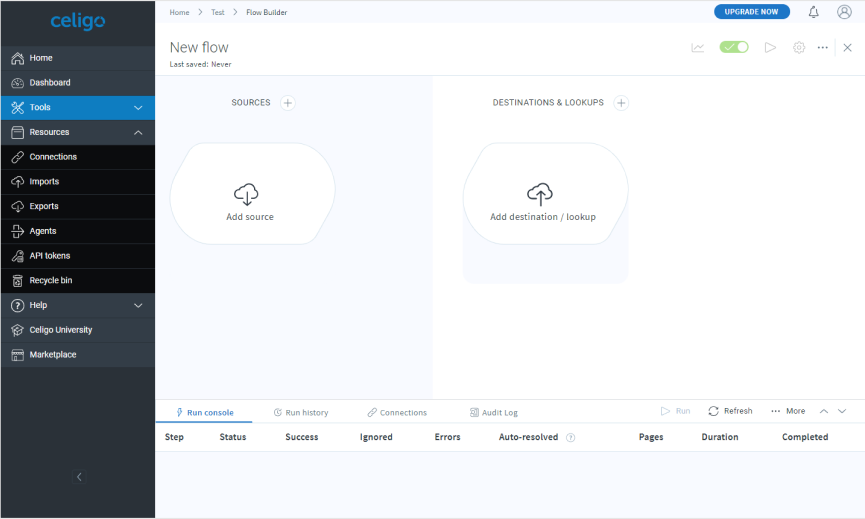
Flow builder: Evolutionary improvement
The first evolution of the new design jumps users right into creating their first flow, getting them to realize value more quickly instead of getting stymied by having to create connections before the flow, which interrupted the task flow.
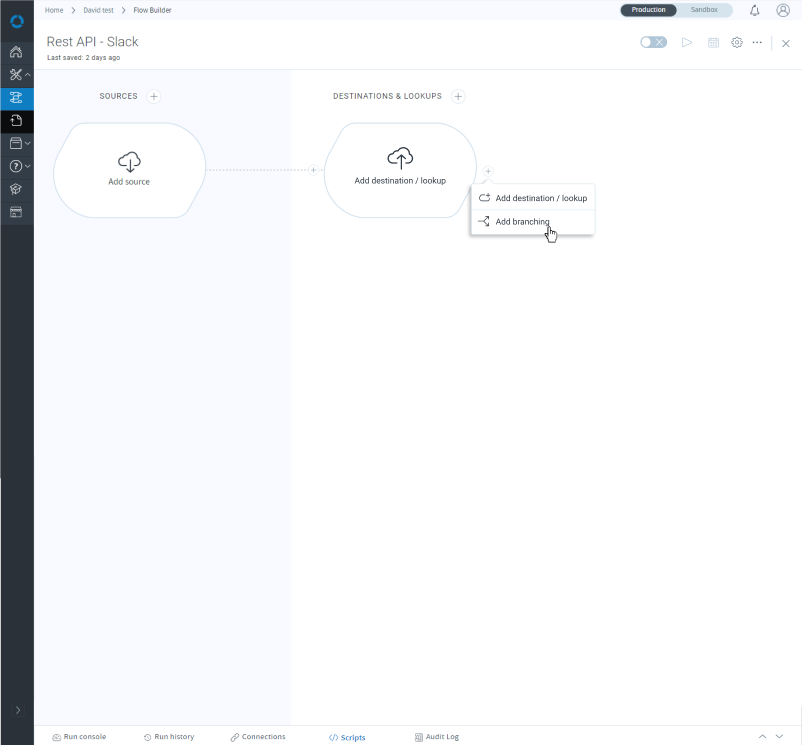
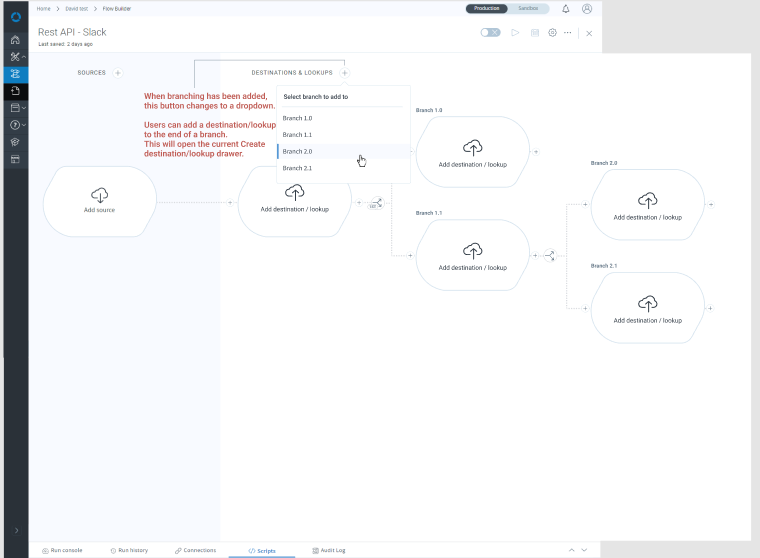
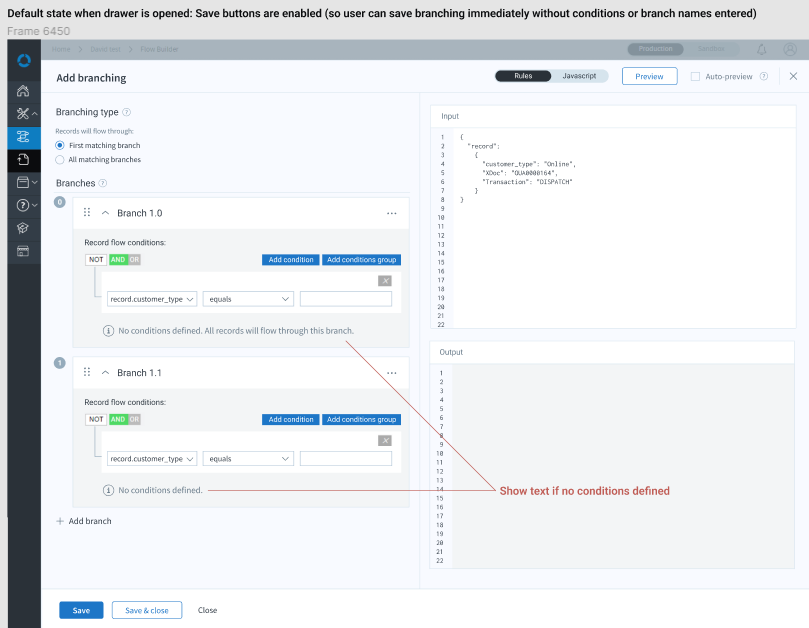
Flow builder: Adding branching
In talking to customers, I discovered that they were attempting to use filters to create a branching logic. Other competitors had actual flow branching, so this was a major functionality gap.
Onboarding
Instead of users being greeted by a blank page, I made a plan for us to fill empty states and provide onboarding. For more onboarding, check out Onboarding call-outs and tours.
![]()
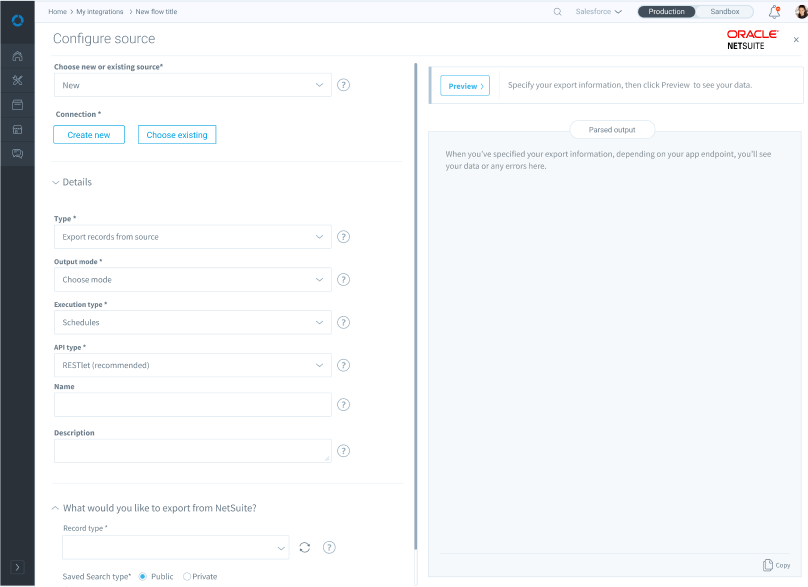
Preview data before running a flow
My design enabled users to test whether they had their application configured correctly before they tried to run any actual data through, reducing time spent creating flows and then troubleshooting runtime errors.
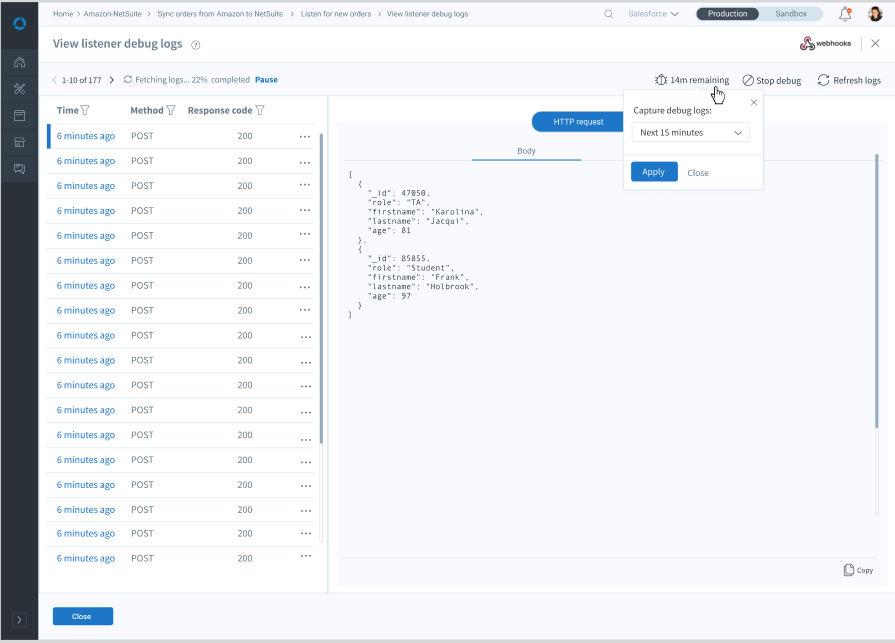
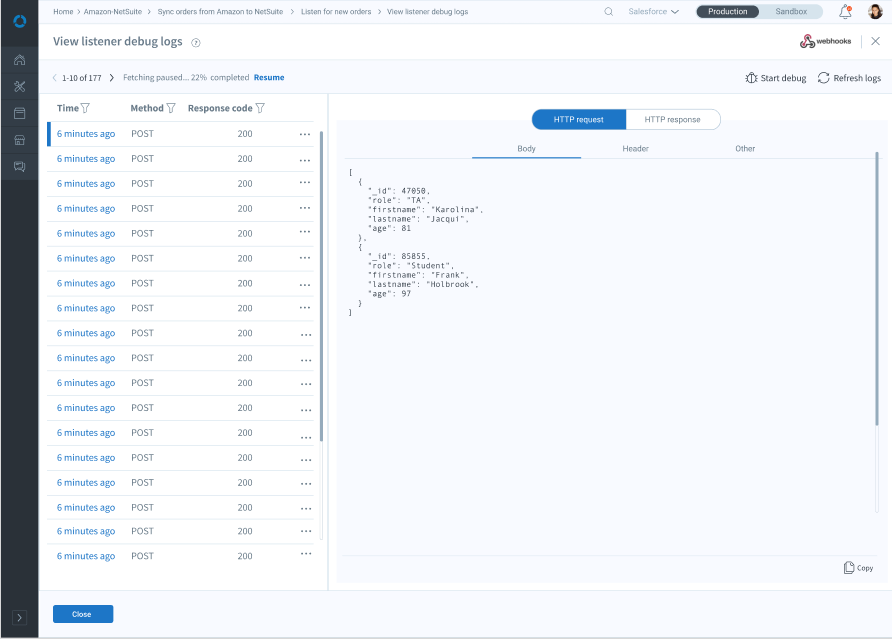
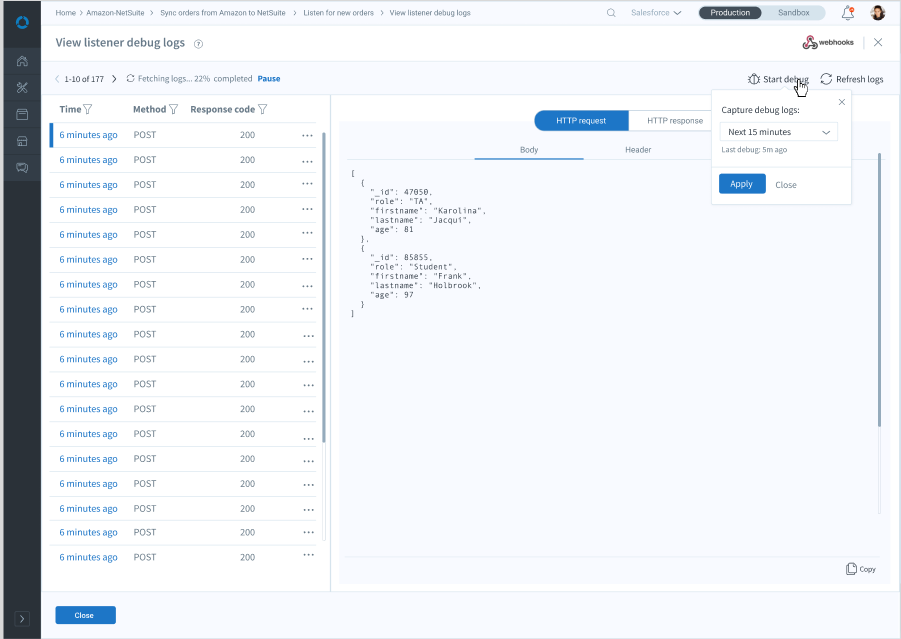
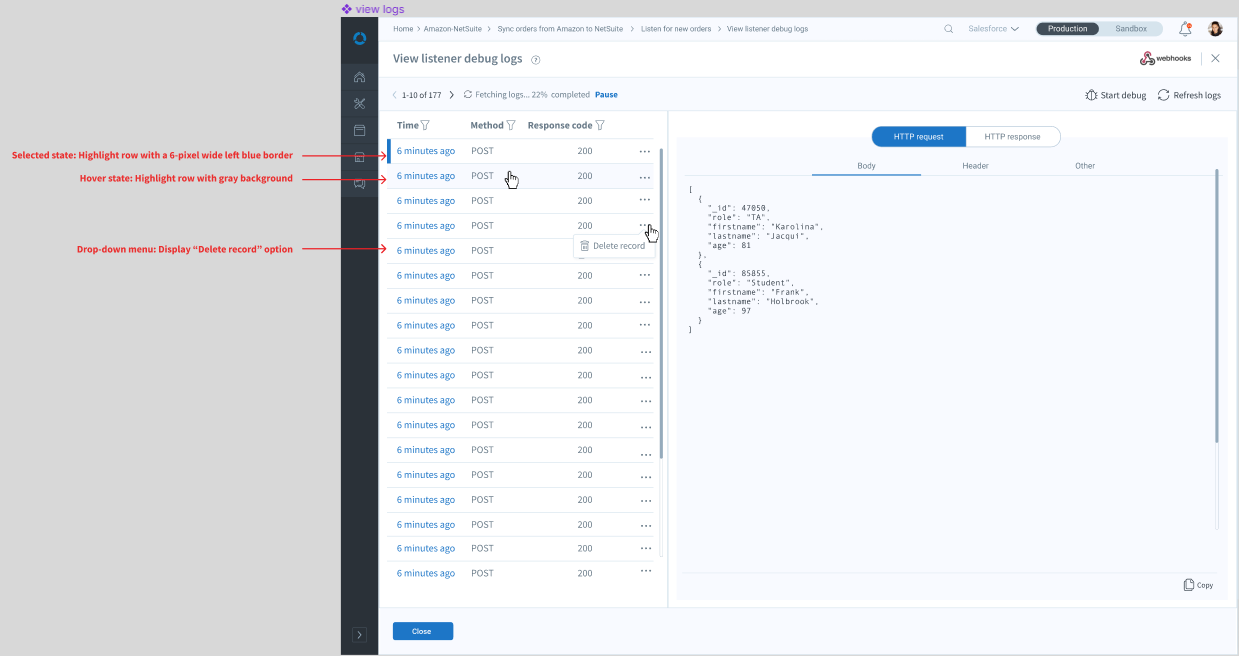
Debug logs
This new design added the ability to debug logs. Previously, users could only debug connections and that functionality was not easily discoverable.
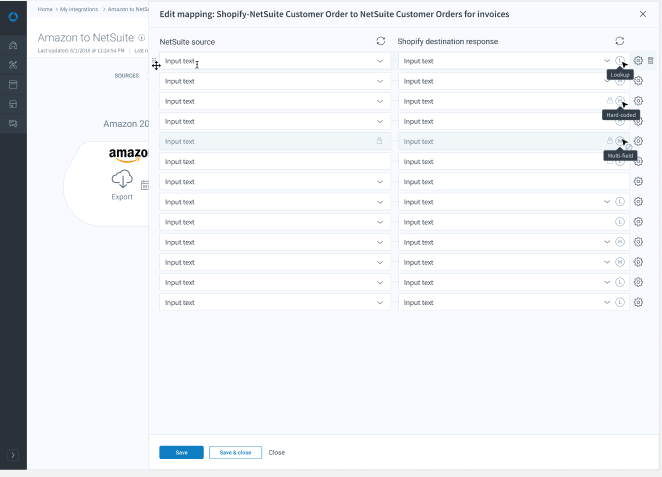
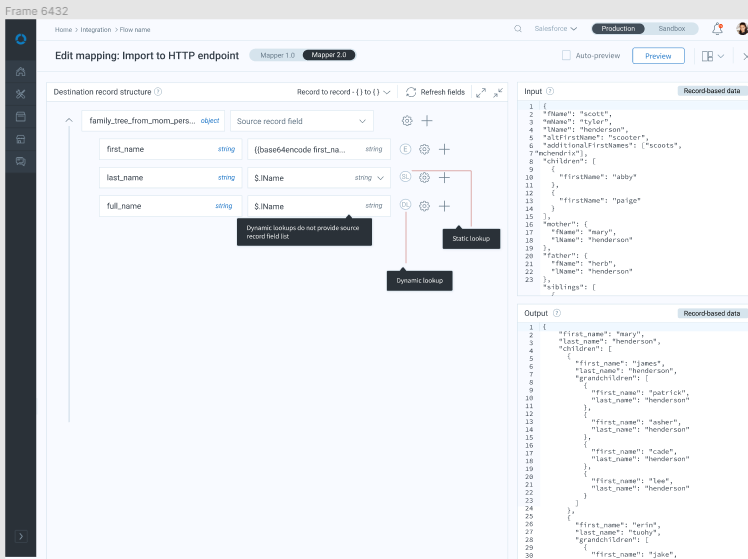
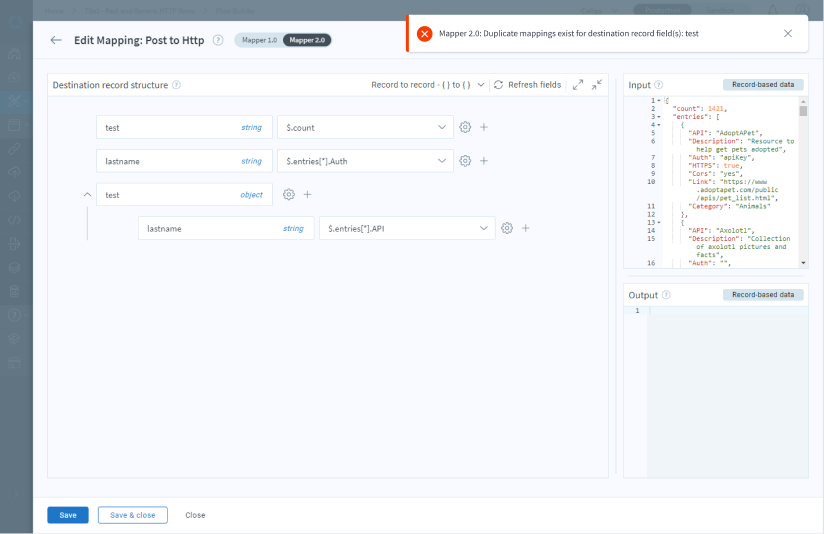
Mapping data to send between applications
Mapping data: Evolutionary design
The old data mapping design did not bring information forward, such as data type, lookup type, whether a field was locked, or where the settings were (displayed only on hover). This made the initial data mapping difficult, as well as future troubleshooting. This is the first evolution of the design, which still forces users to conform their nested JSON records to flat field mapping, forcing them to use handlebars, indexes, and dot notation. The next one below shows the efforts to align more closely with the mental model users had from their nested JSON records.
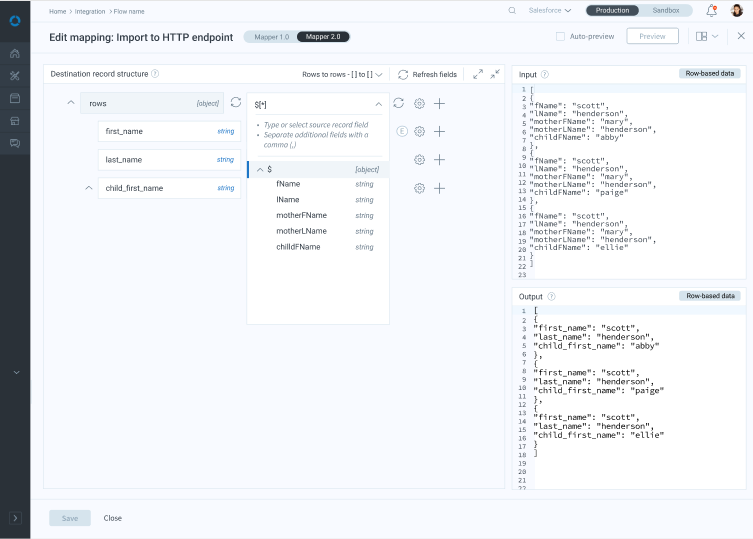
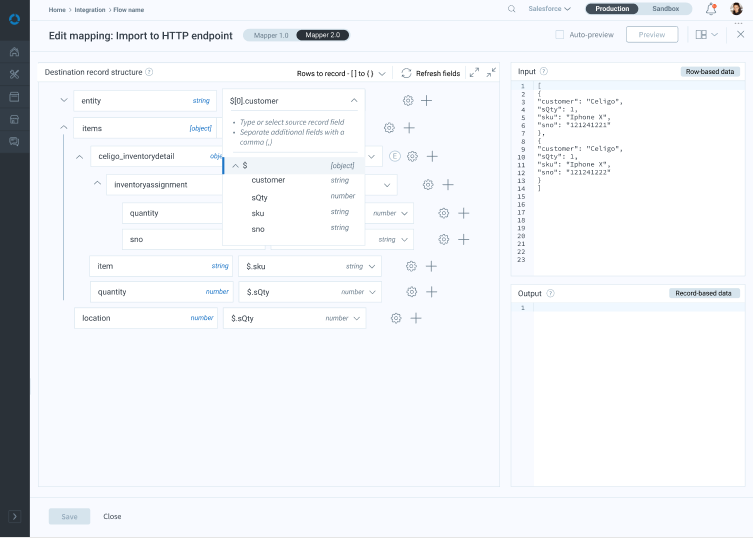
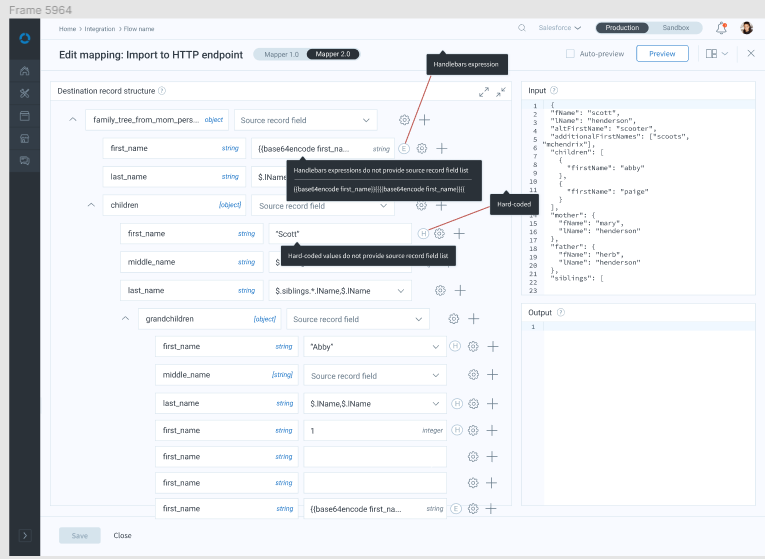
Mapping data between applications: Reducing cognitive burden, then aligning with underlying mental model
The first iteration of the new design enabled users to view input and expected output in data mapping and brought key information forward, then evolved to align with the mental model users had from the underlying JSON record structure they were trying to map from one application to another.
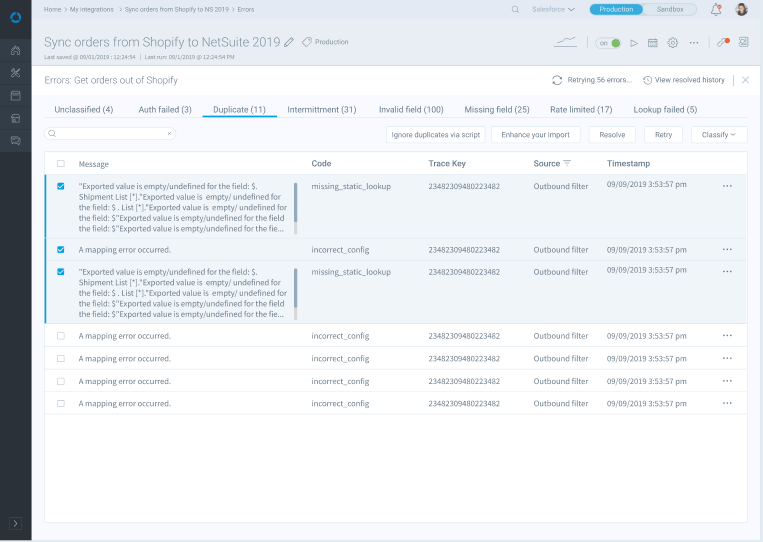
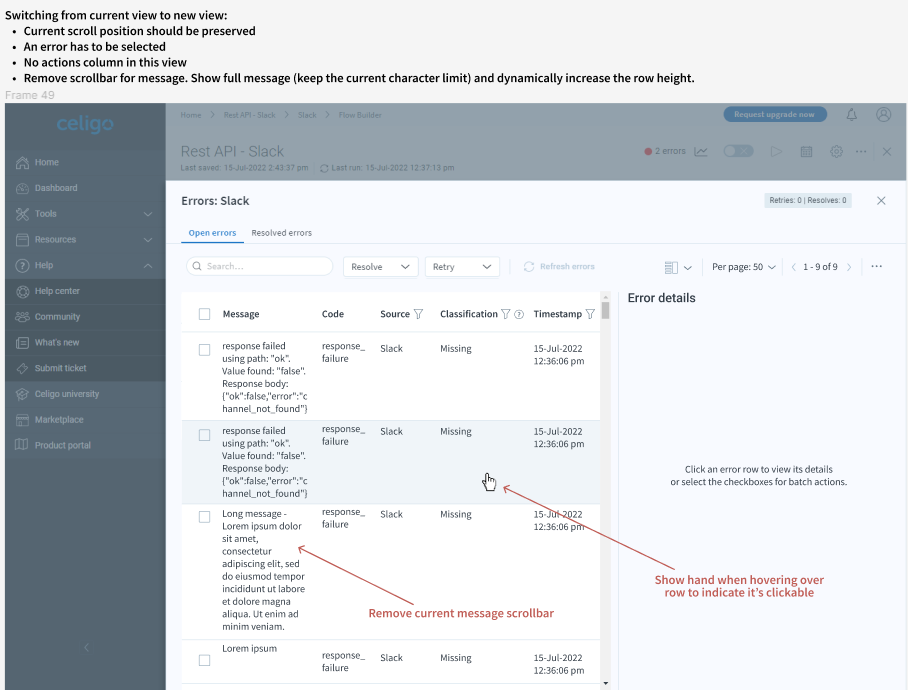
Error management
Error management: Old design
After the inital platform redesign during, error management still did not align with user desires, which was that all errors in a flow or daisy-chained flows are interrelated. Users needed to understand the relationships between the errors, as errors often built on one another, as well as how to fix them. They also needed to get more information on the error in order to troubleshoot it more quickly.
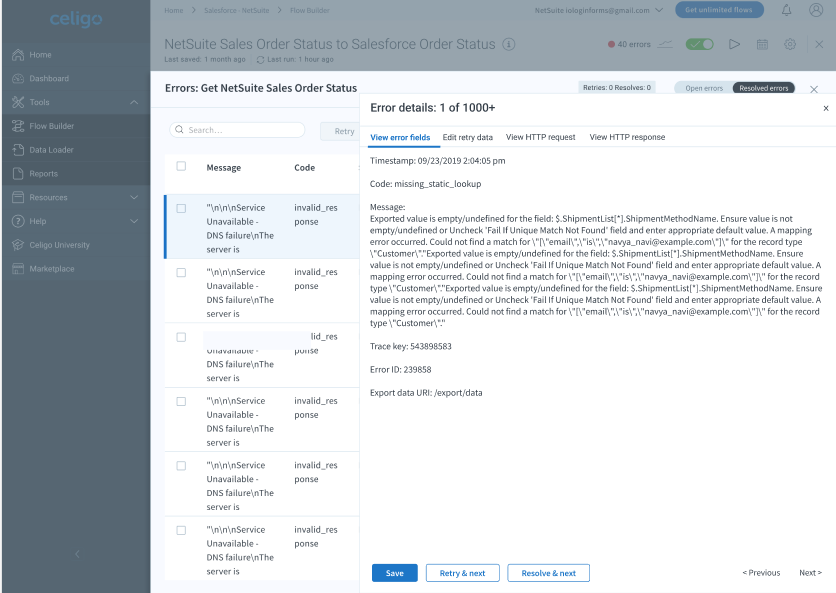
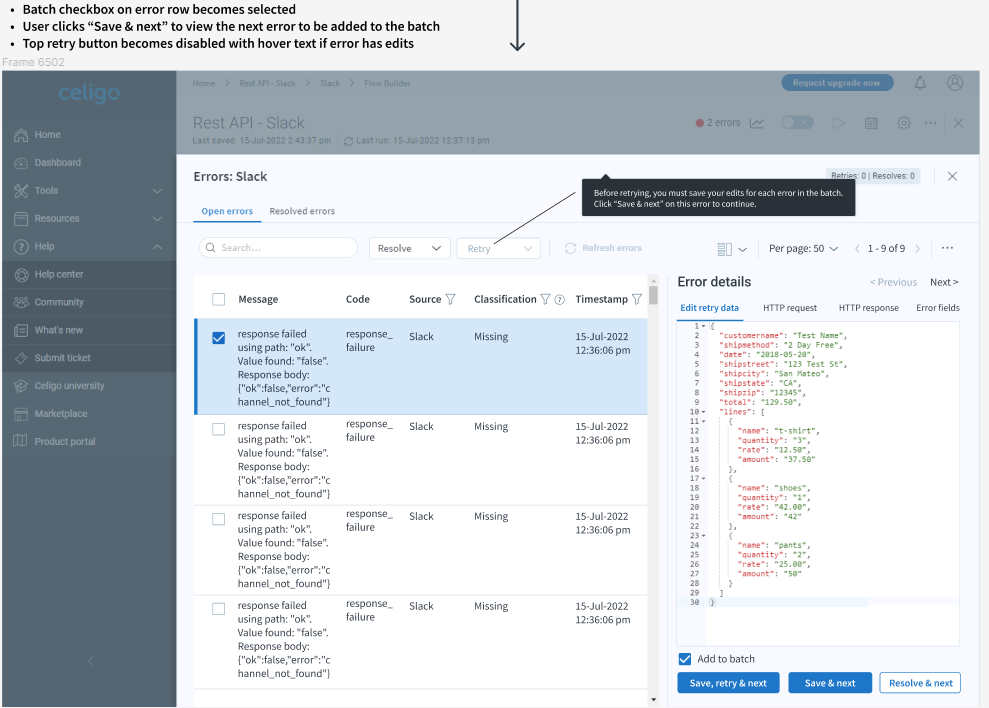
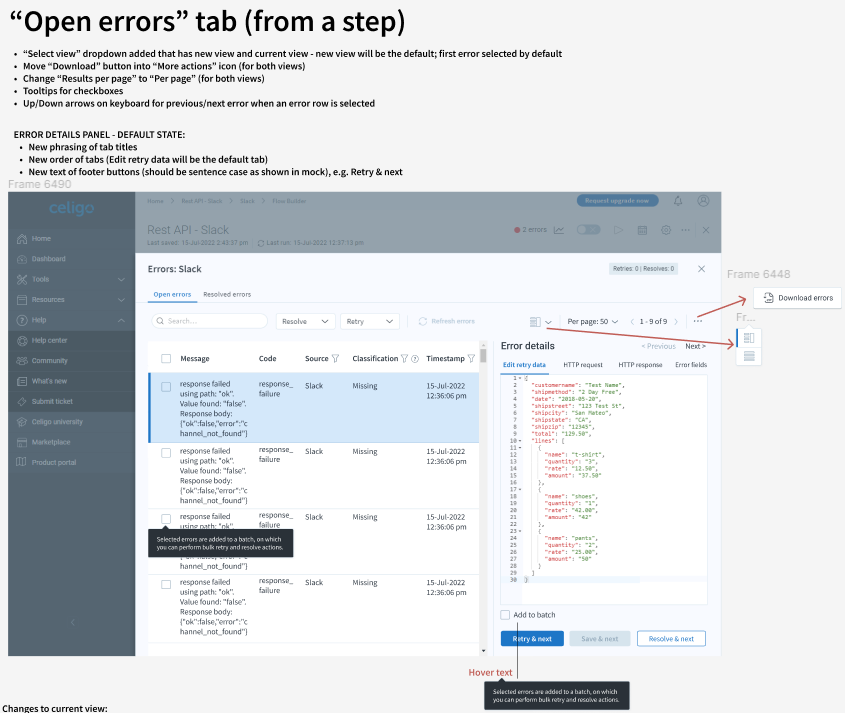
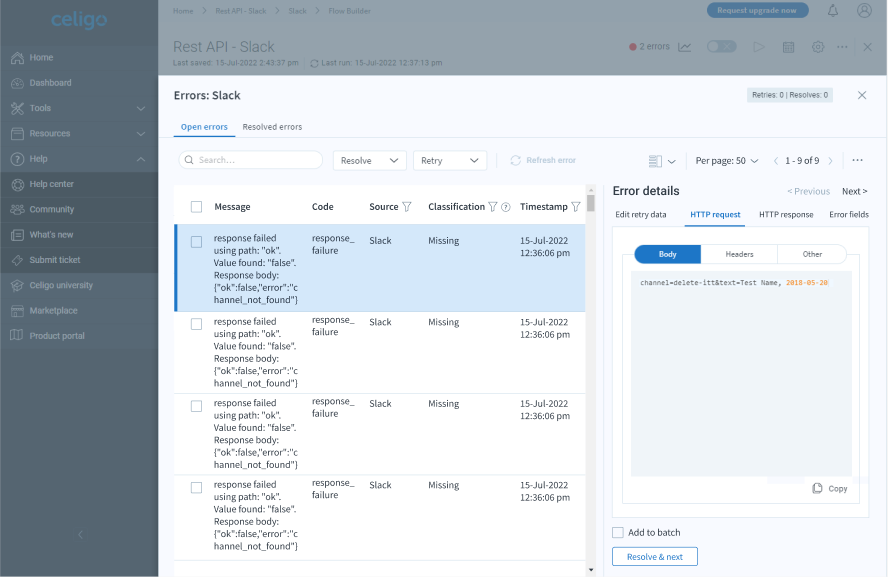
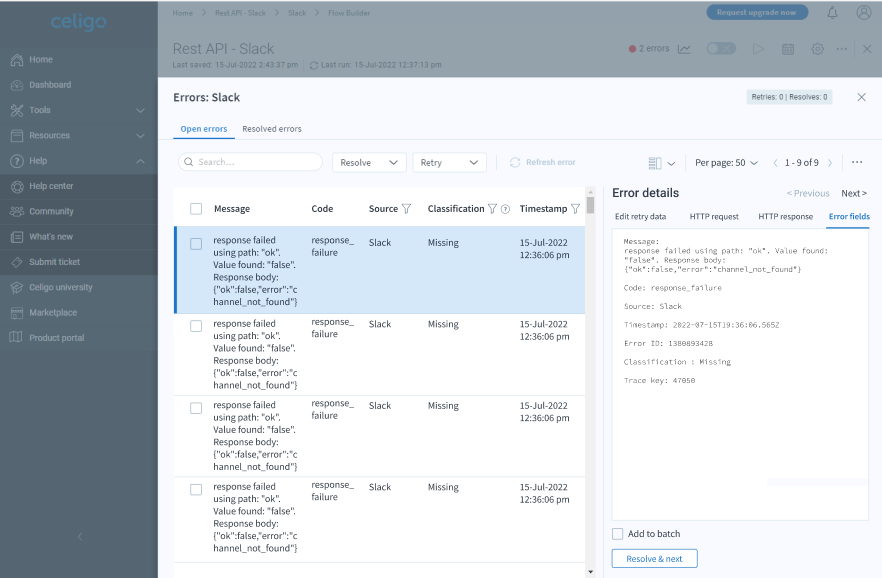
Error management: New design
The new design enables users to get more details on the error, page through errors, and batch similar or related errors for retry or resolve. This was a game-changer for error management for both customers and internal employees, reducing the time to resolve errors from half a day to around 10 minutes.
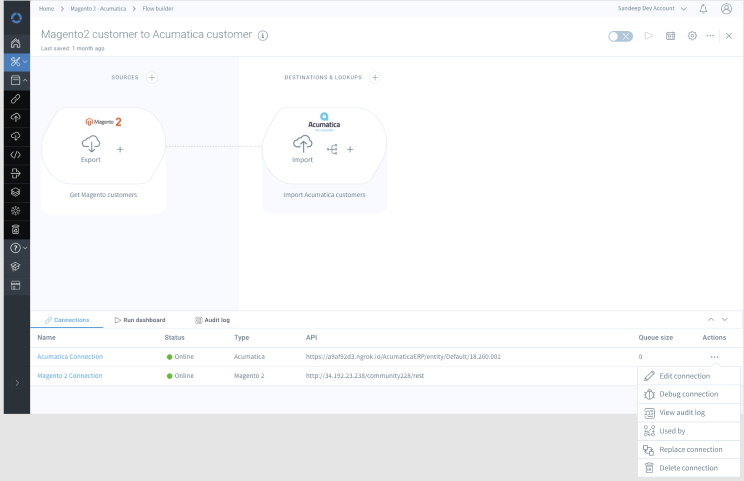
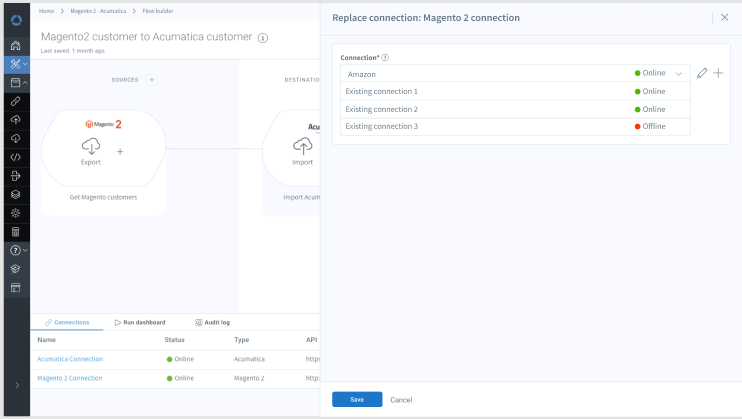
Replace existing connections
Rather than forcing users to create a new flow step and delete the other if they wanted to use a different connection for their application, I enabled users to replace connections. From this came the current project to remove the requirement to configure a connection at all before being able to visually map out your flow. This would make it much easier for LOB (Line of Business) users to do the groundwork before handing the flow off to developers for the technical configuration.